About
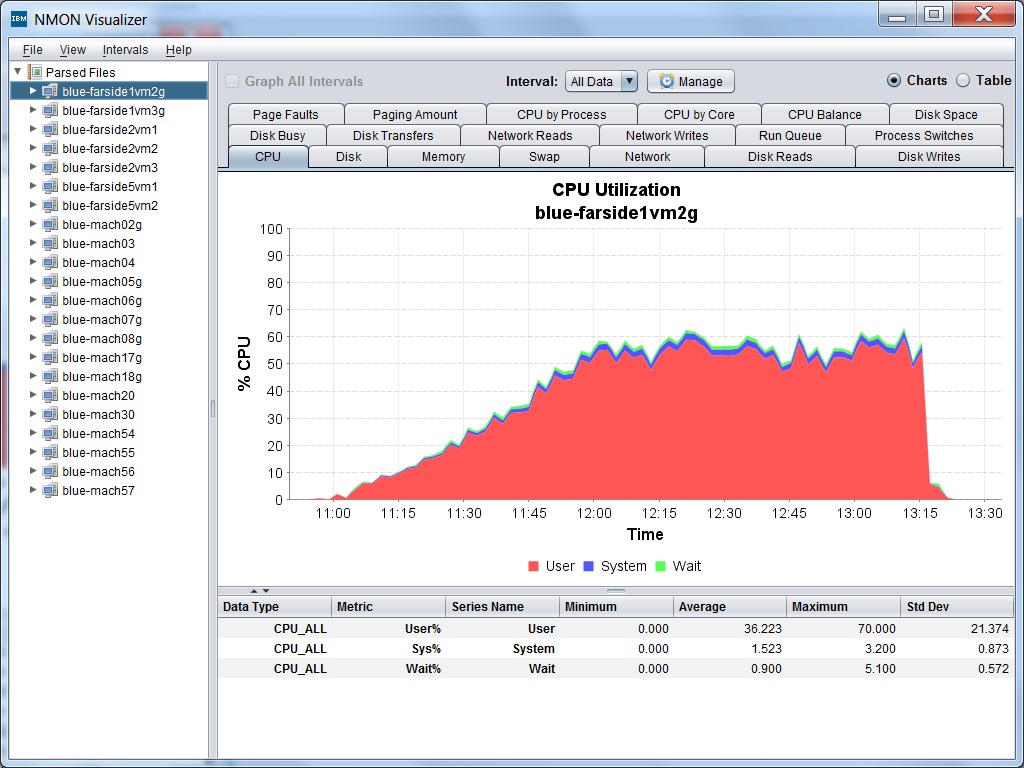
NMONVisualizer is a Java GUI tool for analyzing nmon system files from both AIX and Linux.
It also parses IOStat files, IBM verbose GC logs, Windows Perfmon & ESXTop CSV data and JSON data.
Download the latest version (2025-01-01). Running this JAR file requires Java 11 or newer.
Documentation
Click here for an overview presentation.
Features
- Parse multiple files at once
- Data for different datetimes
- Data from different systems
- Recursively search a directory tree
- Parse the following file types
- nmon output from Linux & AIX
- IOStat output from Linux & AIX
- Windows Perfmon & ESXTop data (exported to CSV)
- IBM Java 6 & 7 verbose GC output
- IBM topas, using topasout -a to output in NMON format
- ZFS data from zpool iostat <POOL> -vTd
- JMeter aggregate CSV files
- FIO output
- JSON files using a custom format
- Display graphs at various levels of detail
- All systems
- Single system
- Single metric
- Define intervals and view data for only a particular subset of the time logged
- Export raw data and chart data in CSV format
- Save graphs as PNG
- Customize and view summary information across all systems in a single table view
- Create custom reports that can be viewed in the GUI or used to create PNGs from the command line.
Font Size
On newer high DPI monitors, NMONVisualizer may be displaying very small fonts. Due to Java Swing limitations there is no easy way to change this at runtime. However, you can change this when starting at the command line by running the program with the command line argument fontSize. For example, java -DfontSize=16 -jar NMONVisualizer_<release_date>.jar will start the program using a base font size of 16 point.
History
NMONVisualizer was an internal project at IBM, started in 2011 by Hunter Presnall to support performance benchmarks of IBM SmartCloud. It was released to open source under the Apache 2.0 license in May 2013.
GitHub is now being used to host the open source project.
