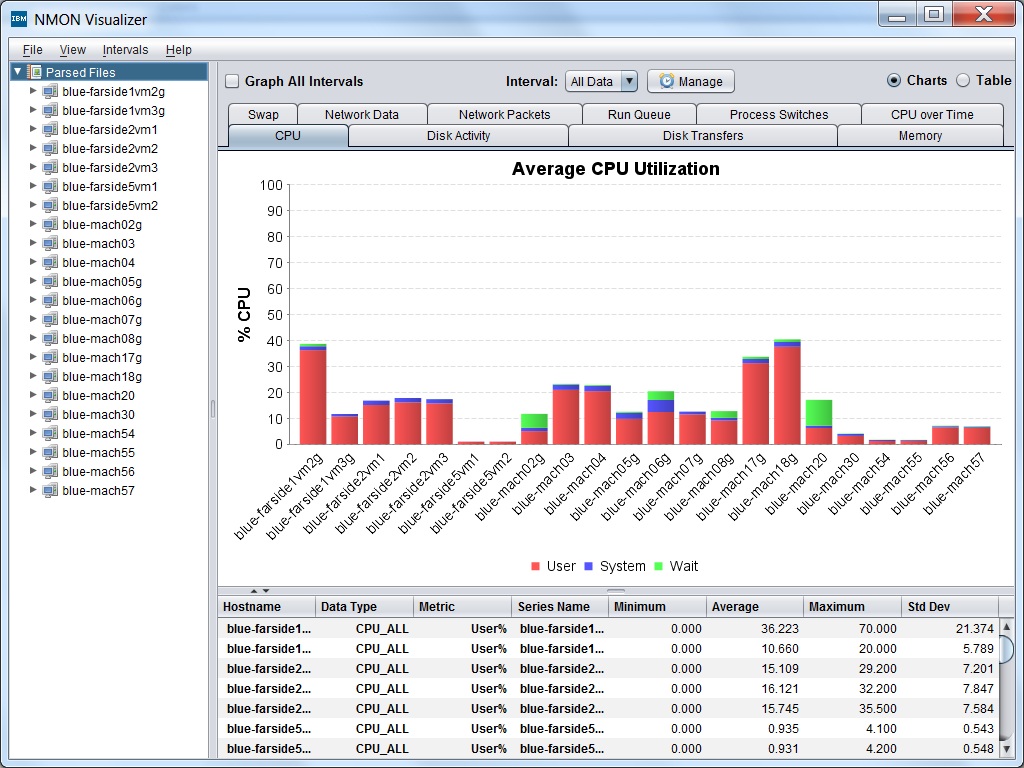
All Systems Report
A set of charts showing data across all systems that have been processed.
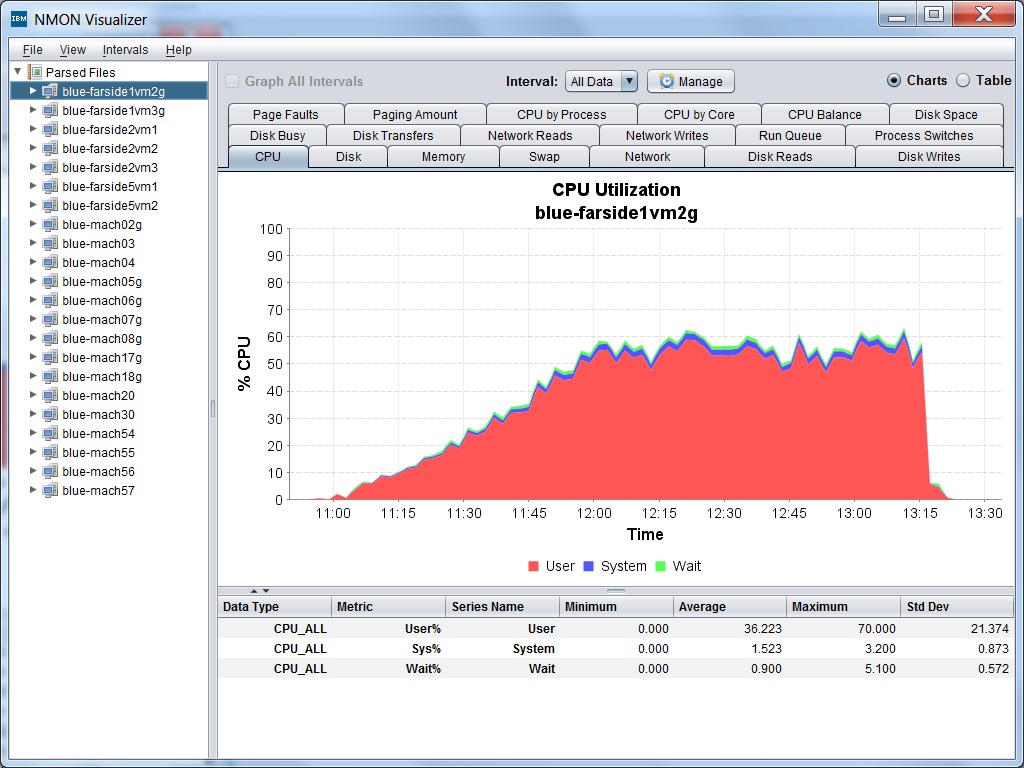
Single System Report
A set of charts showing summary data for a single system.
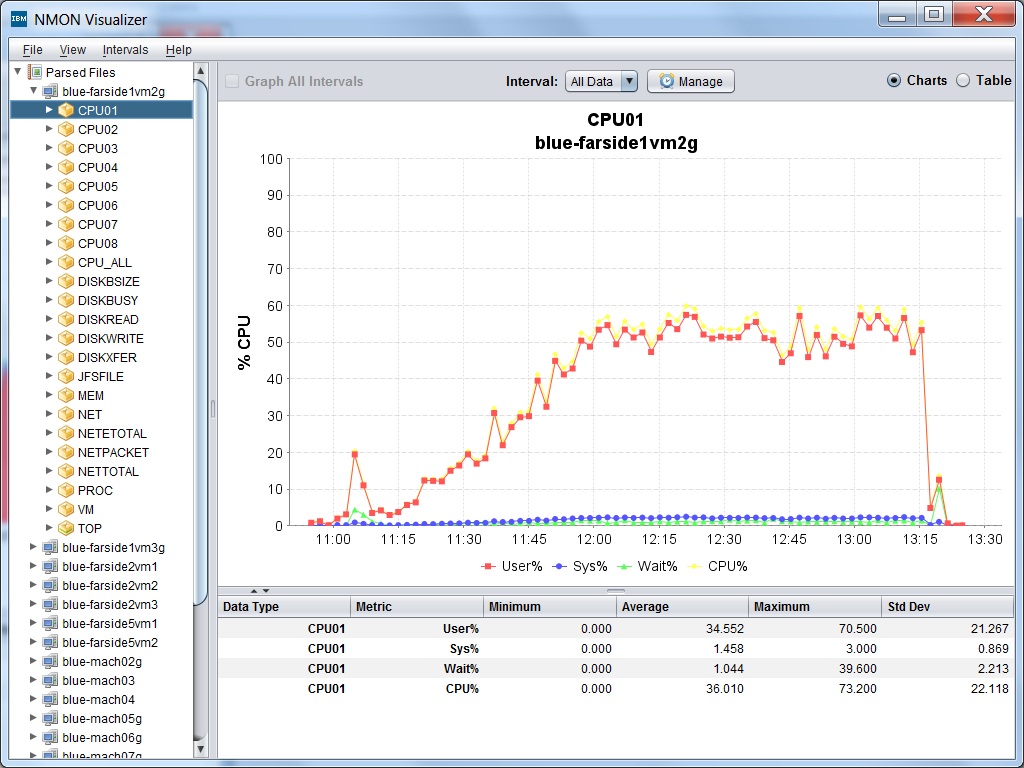
Single Data Type Chart
A chart containing all metrics for a single data type.
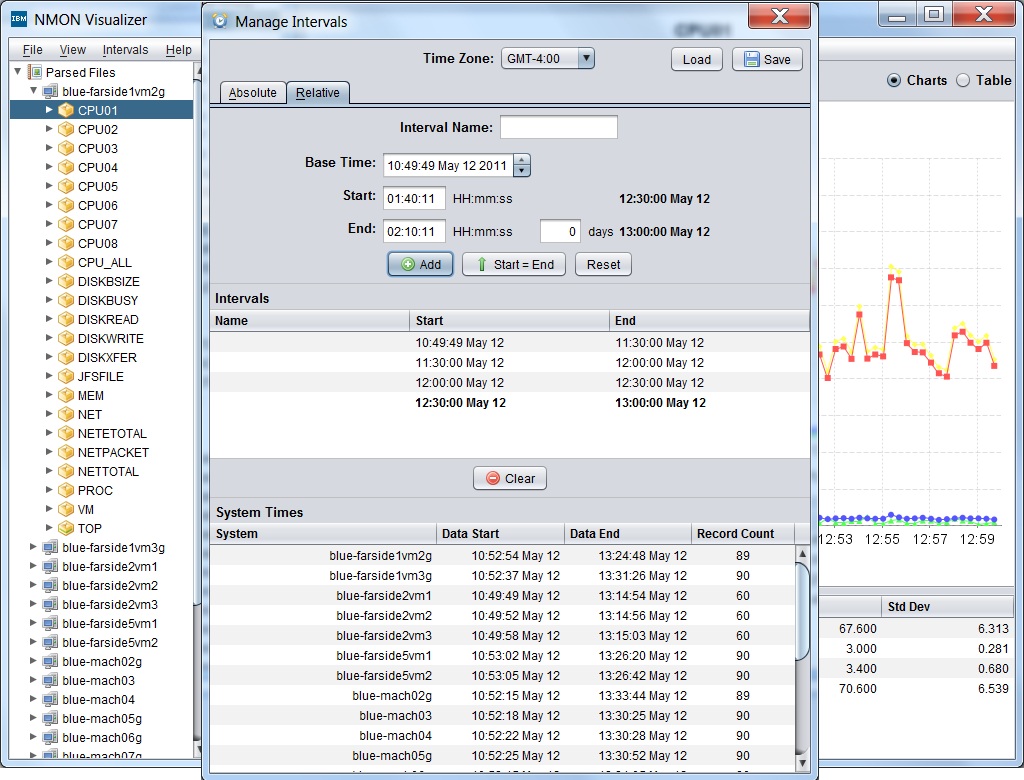
Interval Management
Manage time periods for viewing charts and table data. The interval configuration can be saved.
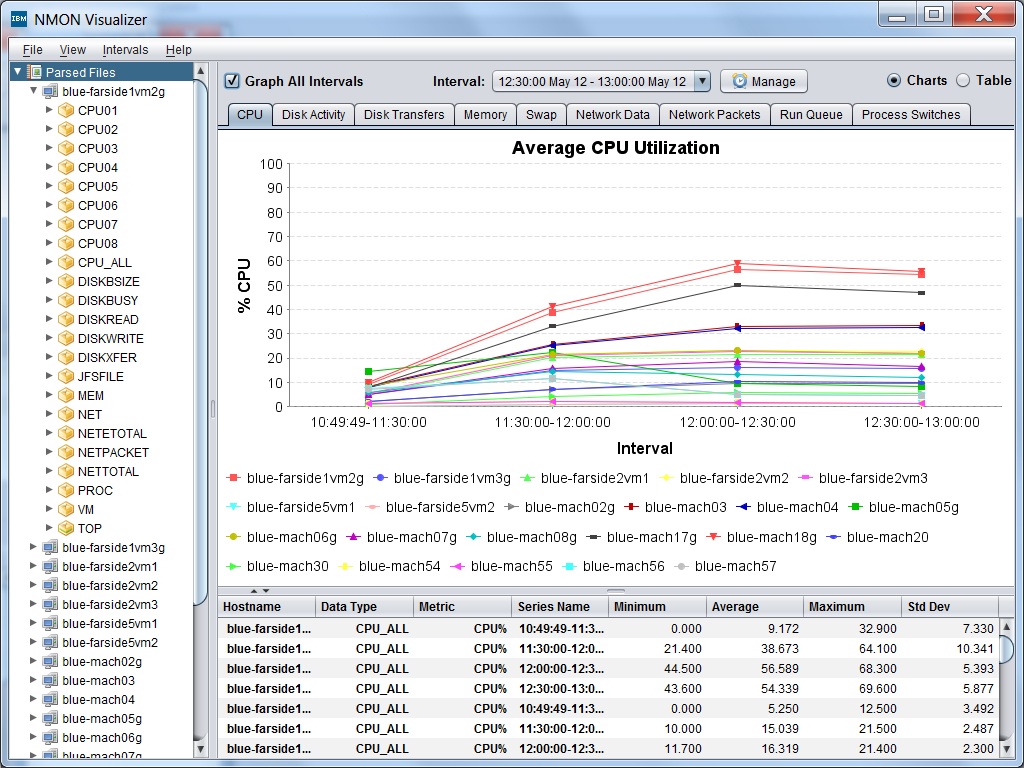
All Intervals Report
A set of charts showing average metrics for each interval.
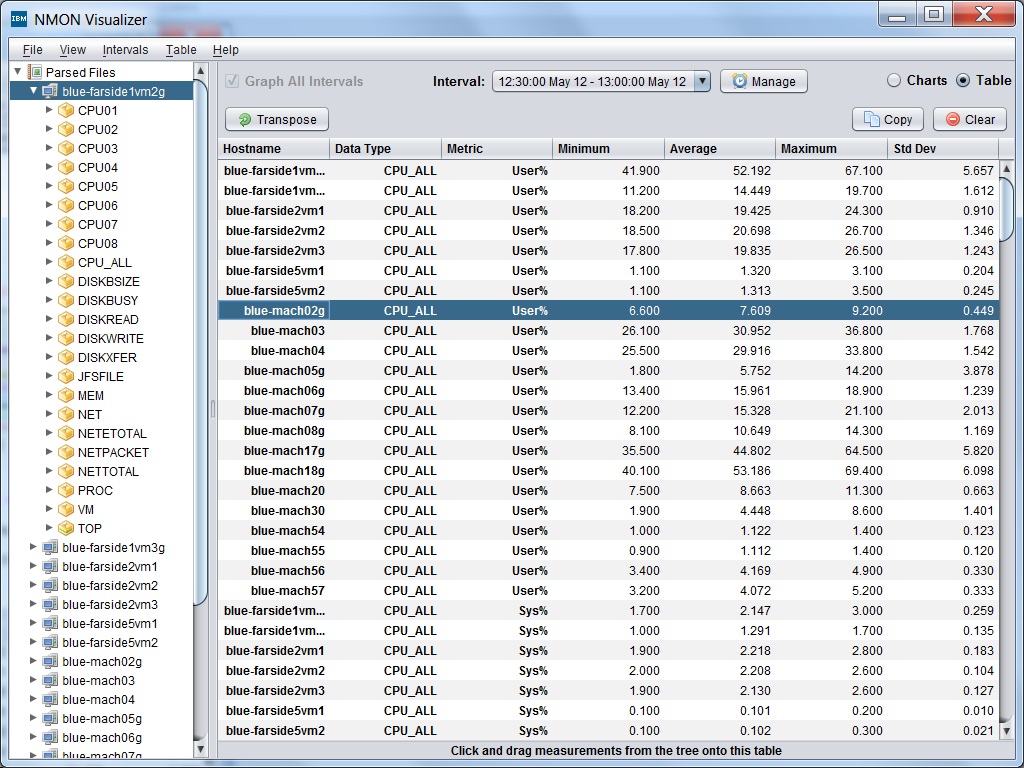
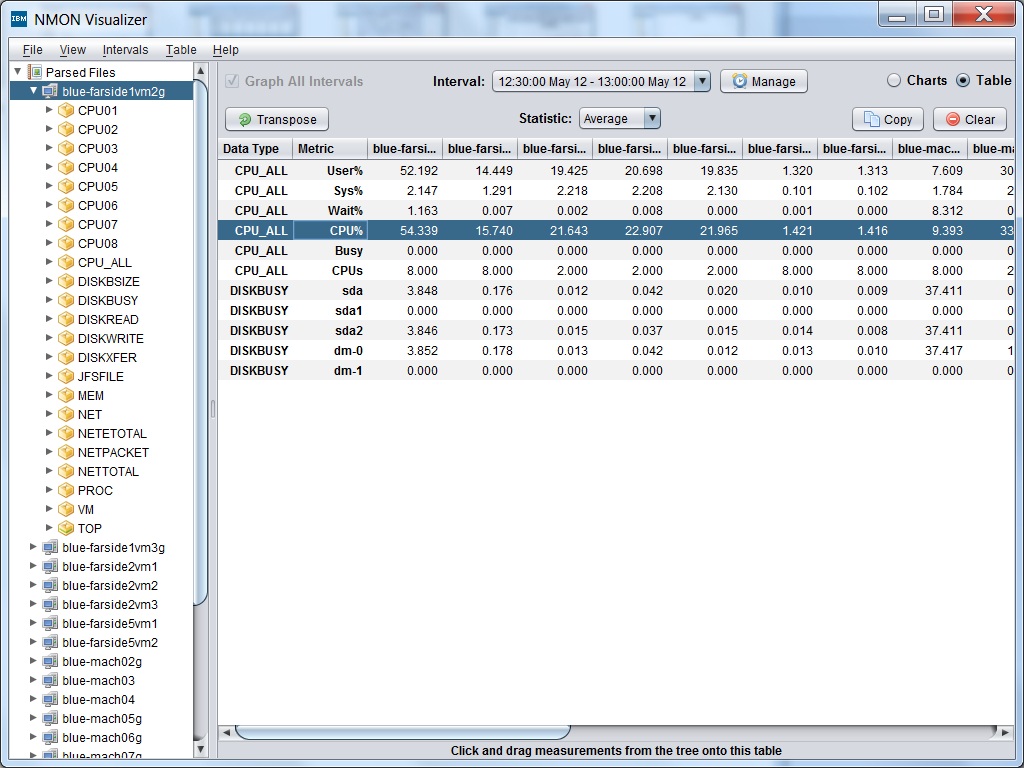
Data Tables
A summary data table can be defined by dragging data from the tree on the left to the table. Two table layouts are supported - by statistic and by system. This data can be copied to the system clipboard. The table definition can be saved.